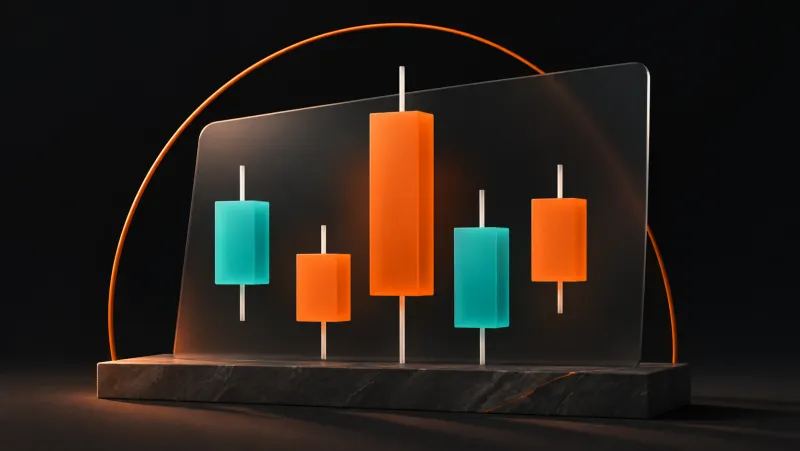
A big green candle has appeared on the chart, covering the previous red one. Your hand is already reaching to open an upward trade: it looks as if the market has drawn you an invitation. But a bullish engulfing pattern first has to be identified correctly, and then you need to understand where it formed and at what price you can still get in. Quite a few details fit between a pretty picture and a winning trade. Let’s break down the bullish and bearish versions with numbers, and then put together a practice scenario for the intrade.bar demo: from choosing a stretch of the chart to reviewing the result. It will help you test the idea step by step, without hunting for perfect candles in hindsight.
What exactly the second candle has to engulf
The basic pattern compares the bodies of two adjacent candles. The body sits between the open and the close; the wicks reach the period’s high and low. So a long candle doesn’t necessarily form an engulfing pattern. Its wick may extend far beyond the neighboring range while its body stays small. To check, you need four numbers: the opens and closes of both candles. Color helps you see the direction quickly, but the conditions themselves are defined by prices.
A bullish engulfing pattern consists of a first falling candle and a second rising one. In the strict version, the second opens below the first one’s close and closes above its open. A bearish engulfing pattern is the mirror image: a rising candle is followed by a falling one whose body covers the first from above and below. Some definitions allow one of the boundaries to be equal. That’s a reasonable separate variant, especially in a nearly continuous market, where adjacent closes and opens are often close together.
Choose one definition before testing. If you count a winning pattern with an equal boundary but exclude a losing one as not strict enough, the edge will exist only in your spreadsheet. To start, it’s convenient to record strict patterns and equal-boundary variants separately. That way you’ll see how many observations each criterion produces, and you won’t be arguing with the chart over how thick a body is drawn.
A bullish engulfing pattern in four prices
The first candle opened at 101.20 and closed at 100.40. Its body spans 100.40–101.20. The second opened at 100.30 and closed at 101.40: its lower boundary is below the first body, its upper boundary above it. The condition is met. The second body is 1.10 in size, the first 0.80. Comparing sizes is useful, but what decides it is both boundaries, not the impression that “the green one is clearly bigger.”
Now keep the second candle’s open the same and change its close to 101.10. There’s a rise, but no full engulfing: the price didn’t cover 101.20. Another case is a large rising candle that sits entirely above the first body. It may also look impressive, but it doesn’t cover the lower boundary. You can study such examples on their own, but mixing them with your chosen pattern is unhelpful: you’ll stop knowing exactly what you tested.
On the intrade.bar chart, start with this simple exercise: find a completed pair of candles and write down the opens and closes. Don’t open a trade just because you found the picture. First make sure you recognize the pattern the same way when zoomed in and zoomed out. If a few minimum price ticks decide whether the rule is met, look at the numbers rather than judging the distance in pixels.
The bearish engulfing pattern and the long-wick trap
Say the first candle rose from 100.40 to 101.20, and the next fell from 101.30 to 100.20. The second body covered the first — this is the bearish version. Meanwhile, the first candle’s high could have been 101.80 and the second’s only 101.50. The body pattern still holds: we never agreed to require every wick to be covered. A condition covering the full range is stricter and has to be tested separately.
A similar picture is called an outside bar when you compare the highs and lows of two periods. It can be an engulfing pattern at the same time, but it doesn’t have to be. The difference seems trivial until you start counting results. One person marks all outside bars, another only opposite bodies, and then both discuss “the same strategy.” In reality, their samples are already different.
Wicks are still useful for context. A long upper wick shows that the price traded noticeably higher and didn’t hold there by the close. It doesn’t reveal the intentions of all participants. It’s better to record the observation literally than to announce that “sellers have taken over the market.” Candles don’t have a press office; you’ll still have to test any conclusion about the next move separately.
Where to look for the pattern: after a move or in the middle of noise
A bullish engulfing pattern is usually considered after a decline, a bearish one after a rise. In that context, the new candle runs against the preceding move. But a decline can also be part of an uptrend: several red candles may turn out to be an ordinary pullback. So before the pattern, mark a wider stretch, the nearest completed peaks and troughs, and any existing zones where the price has reacted before.
In the middle of a narrow range, two opposite bodies often just show a move from one edge to the other. An entry after a big candle then ends up near the opposite boundary, where there’s little room left for a continuation. The same picture at a pre-marked lower area of the range describes a different situation. The shape is the same, the entry location isn’t. This is a useful filter for research, not proof of a guaranteed bounce.
Do your markup before the signal. If support appeared on the chart only after a successful rise, you’ve explained the past but haven’t yet got a rule for tomorrow. Keep the inconvenient cases too: an engulfing pattern at a level followed by a continued decline, a weak pullback after a big candle, no movement at all. They are exactly what shows which restriction really helps and which merely embellishes the story.
Why the candle closes first and the decision comes after
While the second candle is forming, its body changes with the latest price. A minute before the close there’s an engulfing pattern; ten seconds before, there isn’t. If you select only completed patterns on historical data, wait for the close in live observation too. Otherwise you’re testing a neat final picture but trading an intermediate move that the picture didn’t preserve.
Waiting for the close doesn’t lock in your future entry price. The pattern may have ended at 101.40 while the trade opened later at 101.70. If the price is 101.50 at expiry, the upward trade loses, even though the market stays above the pattern’s close. So the record needs two separate prices: the close of the signal candle and the actual opening of the option. A phrase like “it went up after the pattern” is too vague to evaluate a trade.
Set a lateness condition in advance. For example, a practice entry is allowed only at the first available quote after the close; if you got distracted and missed that moment, the episode remains an observation without a trade. Don’t chase the market by changing the rule on the fly. The big candle has already covered the distance, and an attractive shape doesn’t make every subsequent price equally good.
A practice scenario on intrade.bar: engulfing after a pullback
For your first test, choose one available currency pair and a five-minute chart in demo mode. On a wider, completed stretch, mark the rising local lows. Then watch for a pullback to an area marked in advance, without moving it to follow the price. The working hypothesis is specific: after a pullback in an upward structure, a completed bullish engulfing pattern forms while the previous significant low stays intact. This is an example of test rules, not a ready-made profitable system.
If the conditions are met, write down the pattern’s four prices and its closing time. In the intrade.bar trade form, separately check the amount, the Call direction, the selected expiry and the payout shown. For a practice series, you can choose a ten-minute expiry in Sprint mode and the same notional amount in advance, if those parameters are available. A five-minute candle doesn’t oblige you to choose a five-minute option: the trade duration is an independent part of the hypothesis here.
Skip the entry if the structure is already broken, the engulfing pattern hasn’t completed, the price has moved on from the planned moment or the signal appeared right below the nearest resistance area excluded by your rules. Also decide in advance how to treat the timing of major news. Write down the reason for skipping right away. After a loss, it’s far too easy to invent a filter that was supposedly obvious from the start.
On intrade.bar, the result is determined by comparing the opening price with the price at expiry; if they are exactly equal, the amount is refunded. There’s no early closing, so the settlement time is chosen before entry. For the bearish version, mirror it: a downward structure, an upward pullback and a completed bearish engulfing pattern. Don’t combine the results of the two directions until you’ve seen how each behaved on its own.
How to tell whether the rule helped
In a separate record, save the instrument, date, time, context, prices, amount, payout, expiry and result. In intrade.bar statistics you can review real and demo trades separately, compare assets and expiries, and export closed trades to CSV. Add the pattern’s name and your reason for entry to your own notes: the built-in tools don’t provide strategy tags for this kind of review. This connects the actual history with the explanation of your decision.
Read the win rate together with the economics. With a notional 80% payout and the same amount each time, ten wins and ten losses give a negative result: 10 × 0.8 − 10 = −2 trade amounts. For this example, with no extra costs and ignoring refunds, the break-even point is 1 / 1.8 ≈ 55.56%. Take the actual payout from the form of the specific trade, not a familiar number from an old note.
First fix the rules, then collect every qualifying episode over a period chosen in advance, and after that test them on the next period. Adjacent signals within one impulse are dependent, so a series of several winning entries says little about robustness. If you change the expiry, the context or the definition of engulfing, start a separate series. That way you’ll be able to explain what you improved, instead of a vague “now I can feel the market.”
How to start practicing
Open the intrade.bar demo and first mark up a few patterns without trading. Check the bodies, wait for candles to complete and note where each picture sits in the structure. Then choose one described hypothesis and follow it from signal to expiry with virtual funds. A good outcome of this exercise is a clear record you can repeat, even if a particular option closed at a loss.
Engulfing is useful because it lets you briefly describe a notable change in price. Beyond that come the trader’s decisions: which context to accept, at what price to enter, how long to wait and when to walk away. The more clearly these decisions are worded before the trade, the less magic is left in two candles and the more useful their analysis becomes.
Questions and answers
Does the second candle have to engulf the first one’s wicks?
For a body engulfing pattern, comparing the opens and closes is enough. Covering the entire range is an additional condition that has to be tested separately and applied to every observation.
Can I enter before the second candle closes?
You can research a separate intra-candle hypothesis, but that’s a different rule. The scenario described for intrade.bar requires a completed pattern first; a historical chart doesn’t preserve all its intermediate changes.
Which expiry should I choose for engulfing?
The candle shape doesn’t determine the expiry. In the practice scenario, one fixed expiry is chosen for the whole series. Its result is checked against actual entry and settlement prices, and other expiries are studied separately.
Place your first practice trade
A demo account opens right after registration