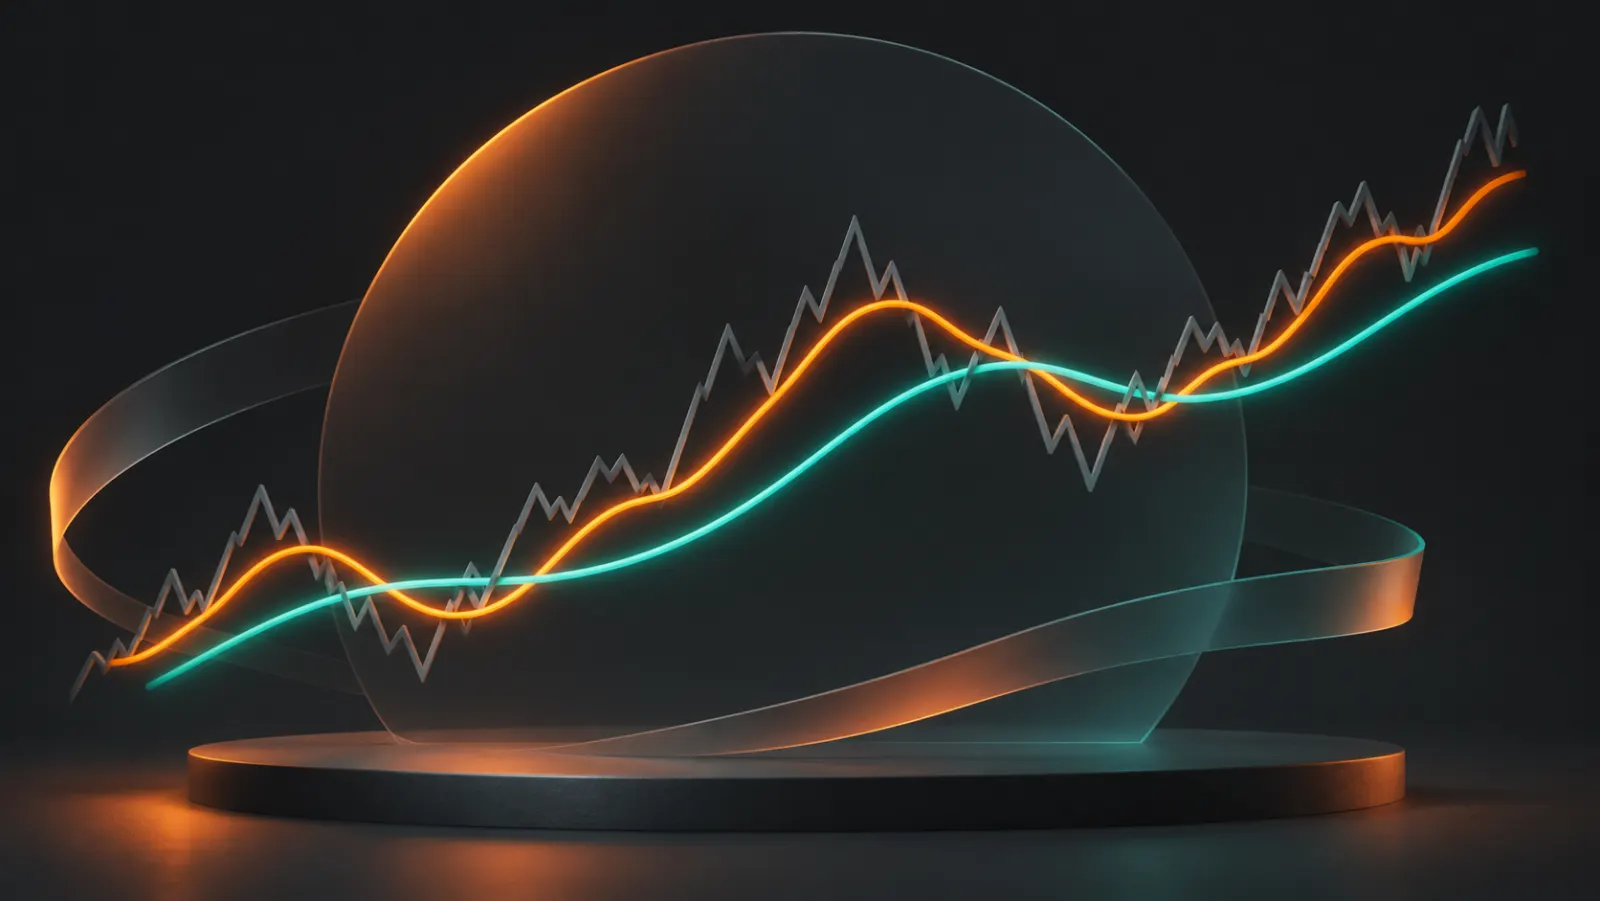
You added a moving average to the chart, and the chaotic candles turned into an almost understandable picture. Then the price crossed the line back and forth a few times, and the clarity went somewhere. That happens when you expect smoothing to deliver a ready-made decision. SMA and EMA really do help reveal the structure of the data, but they do it in different ways. Let’s compare them on the same number series, look at the lag and put together a practice scenario for intrade.bar: the average is used to select a pullback, not to hand out permission to trade on every touch.
What a moving average line on the chart means
A simple moving average, SMA, averages the chosen values over a set window. An exponential moving average, EMA, gives more weight to fresh data while keeping a gradually fading influence from earlier history. Both lines transform prices that are already known. Their job is to make the series easier to analyze, not to predict a new value out of thin air.
A period of 20 on M5 refers to twenty five-minute bars; on an hourly chart, to hourly ones. Closes are used most often, but the source can be different: the open, the high or a combination of a candle’s prices. For a fair comparison of SMA and EMA, use one source, one period and the same time boundaries. Otherwise the difference between the lines will be explained by several changes at once.
An average of closes isn’t the price at which “the whole market built its position.” It doesn’t reconstruct the volume of each trade or the intentions of participants. You can use it as a reference for where the price is relative to the recent series, but not as a point that large buyers are obliged to defend. When the description stays accurate, the line becomes more useful: you understand which question it answers.
SMA by hand: a new price comes in, an old one drops out
Take five closes: 100, 102, 101, 103 and 104. Their sum is 510, so the SMA 5 is 102. The next close, 106, replaces the oldest one, 100. The new five are 102, 101, 103, 104, 106; the sum is 516 and the average is 103.2. After a close of 110, the value 102 leaves the window, and the SMA of 101, 103, 104, 106, 110 becomes 104.8.
The change in SMA can be calculated quickly: the new value minus the one that dropped out, divided by the period. When 106 arrives, that’s (106 − 100) / 5 = 1.2; when 110 arrives, (110 − 102) / 5 = 1.6. The line reacts both to the fresh price and to the departure of an old one. If an unusually high close leaves the window, the SMA can fall without any new sharp drop in the market.
Even two identical latest closes don’t guarantee that the average stays still. Another 106 came into the window and 102 left: the SMA 5 will add 0.8. So the slope of the line isn’t the same as the direction of the last candle. It describes the update of the whole window. This simple calculation is especially useful when it seems the average is “moving on its own” and giving a hidden signal.
EMA: fresh data weighs more
For the common EMA, the coefficient alpha = 2 / (n + 1), where n is the period. The new EMA equals the previous one plus alpha multiplied by the difference between the fresh price and the previous EMA. With a period of 5, the coefficient is 1/3. The current price gets a third of the weight in the new result, and two thirds go to the line’s previous state.
Let’s start with the SMA of the first five numbers as the initial EMA: 102. After a close of 106, we get 102 + (106 − 102) / 3 ≈ 103.333. After 110, we get 103.333 + (110 − 103.333) / 3 ≈ 105.556. In this series, the EMA rose faster than the SMA, because the latest gains received more weight. But an earlier reaction by itself says nothing about the financial result of the next trade.
The starting point matters. One chart may calculate the EMA over a long history, another may start from a later stretch. At the start the values can diverge, then the influence of initialization fades. So when comparing, give the indicator enough history. Don’t declare the quotes wrong just because two lines didn’t match on the first available bar.
EMA sensitivity and the SMA window effect
In an SMA 5, each of the five prices has a weight of 20%; outside the window, its influence disappears. In an EMA 5, the fresh price weighs about 33.3%, and earlier ones keep taking part through successive updates. The period of 5 here sets the coefficient, not a hard boundary on history. So the statement “both lines look at only five candles” is wrong for the EMA.
After a single spike, the SMA keeps the unusual price’s contribution the same until it leaves the window. In the EMA, that contribution starts shrinking with every new step. In a sustained move, sensitivity can help you notice a change earlier, while in a quick reversal it can cause an unnecessary switch. Choosing between the lines is like choosing how much to smooth an image: more detail doesn’t always mean more useful information.
The EMA also doesn’t always have to be closer to the current price than an SMA of the same period. Their relative position depends on the entire path of the series. Try looking at a jump followed by a pause: both lines gradually catch up to the new level, but they follow different paths. The mechanics are easier to see here than in a random pair of nice crossovers.
Average period and lag
A short average follows the recent stretch more closely; a long one smooths it more. Along with smoothness, lag usually grows. But there’s no universal rule that one line is always two candles late and another five. A sharp jump, a steady rise and alternating candles will produce different paths. Reaction time is worth measuring relative to a specific event.
The popular 50 and 200 combination is common on daily charts. If you carry it over to M1, it takes on a different time meaning. The popularity of parameters is no substitute for testing on your asset and time horizon. For a first exercise, it’s better to pick one clear set and explain what part of the move it describes than to pile every popular number into one window.
If you’re comparing two settings, decide in advance what counts as an improvement. Fewer changes in slope show a smoother line, but not necessarily better trading. An earlier crossover can come with more false switches. A financial conclusion requires the entry price, the expiry, the amount and the payout. Winning a “smoothest line” contest doesn’t award the indicator a diploma as a profitable strategy.
Crossovers and touches: define the event first
The price can touch the average with a wick, cross it within a candle or close on the other side. These are different conditions. In the current period, the line is often recalculated too, so a fleeting crossover may disappear by the close. If you study closed candles, stick to that rule when observing in real time as well. That way, history and the demo test will describe the same process.
A crossover of two averages changes their relative position. Specify the type and period of each: EMA 20/EMA 50 and SMA 20/SMA 50 won’t necessarily give the same moments. In a directional move, a crossover can look convincing; in a range, the lines swap places many times. Keep the entire chosen period, including those inconvenient stretches, or the result will end up as an advertisement for a few lucky pictures.
The term “dynamic support” describes an observed interaction between price and the average. The line has no physical mechanism that is bound to stop a decline. To test a bounce, define an acceptable touch, the confirmation, the entry moment and the expiry. Separately note the cases where the price went further. Without them, you’re only studying situations where you already know the answer.
A practice scenario on intrade.bar: a return after a pullback
For a demo test, choose an available currency pair, five-minute candles and an EMA 20 on closes. intrade.bar has a TradingView chart; use the tool you need if it’s available in your set, or a separate chart with comparable quotes. In the latter case, write down the source, the time and the timeframe. An analytical line doesn’t change the prices at which the option is settled on the platform.
Start with an upward structure where the latest comparable highs and lows are rising. The EMA 20 is also rising over the last three closed candles. Then wait for a pullback: a candle touches the average or closes below it, but the chosen structural low stays intact. The practice event is a subsequent close back above the EMA 20. That way, the line sets a specific return condition, and the structure limits the context.
Before a Call trade, check whether there’s an upper area marked in advance right above the price. Set the condition for excluding it before the series. In the intrade.bar form, separately specify a fixed notional amount and an expiry, for example 10 minutes in Sprint if available, and write down the payout shown. Record the actual opening price. An EMA 20 on M5 doesn’t contain any instruction to choose exactly this expiry: it’s a separate hypothesis to test.
Skip the episode if the low is broken, the average has turned almost flat and the price is crossing it again and again, the confirming candle hasn’t closed yet or the entry was missed. For a strict test, “almost flat” is replaced by a measurable criterion; in our simple version, it’s enough that the EMA hasn’t risen three times in a row. Don’t change the period from 20 to 18 just to keep a nice signal.
For the downward version, set separate mirrored conditions. intrade.bar has no early closing, so an opposite crossover after entry won’t end the option automatically. It’s settled at the chosen expiry, and if the prices are equal, the amount is refunded. This mechanism makes a predefined expiry part of the strategy, not a technical detail to be decided after the signal.
How to compare SMA and EMA without curve-fitting
Run one series with the EMA 20 and keep every qualifying case. For comparison, run a separate test of the SMA 20 with the same conditions for structure, time, amount and expiry. Compare the number of signals, the lag relative to the source event, the share of trades where the rules were followed and the financial result. Don’t switch to whichever line better explained an already open contract: that would be a third rule that hasn’t been worded yet.
intrade.bar statistics separate the demo and real accounts, show assets and expiries, and let you export closed trades to CSV. Add the type of average, its slope and the reason for entry to your own records. Check the price and time of each trade. Even if both lines showed a similar return, a small difference in the actual entry can change the outcome of a short option.
Factor in the payout when evaluating. For example, with a notional 85% payout and equal amounts, 50 wins and 50 losses give 50 × 0.85 − 50 = −7.5 trade amounts. So a setting with nice crossovers doesn’t solve the problem yet. After the stretch you’ve studied, test the rule on the next one without changing the parameters, and set dependent entries within a single move apart.
A first useful exercise
Open the intrade.bar demo and first compare the behavior of the price and one chosen average without trading. Find a sustained move, a range and a single jump. Then go through the practice pullback scenario with fixed conditions. If you can explain why you need the line, why this moment was chosen and what would make you skip the entry, the moving average is already doing useful work.
SMA and EMA offer different ways to smooth the same history. The choice becomes meaningful when it’s tied to your task: seeing the structure, identifying a return after a pullback or comparing reaction speed. An average doesn’t have to guess the next candle to be useful. It’s enough that its role in a testable decision is clear to you before the trade is opened.
Questions and answers
Is EMA better than SMA because it reacts faster?
A faster reaction also increases sensitivity to short swings. Compare the lines on one task defined in advance and under the same trade conditions, not on a single lucky crossover.
Does EMA 5 only take five candles into account?
No. The period sets the smoothing coefficient, and the influence of earlier history gradually fades through the previous value. With SMA 5, the window really is limited to the five selected prices.
Can I choose the expiry based on the average’s period?
There’s no direct correspondence. The period refers to the calculation bars, while the expiry determines the moment of the option’s result. On intrade.bar, they are fixed separately and tested together in one series.
Place your first practice trade
A demo account opens right after registration