On the chart, the price is still rising, but the MACD bars are already shrinking. It looks as if the indicator is arguing with the market. In fact, it’s simply answering a different question. The MACD indicator shows the difference between two averages and how that difference changes relative to its own smoothing. Once you understand what each line measures, the temptation to open a trade based on the color of one bar disappears. Let’s break down the mechanics with numbers and build a practice scenario for intrade.bar: MACD helps select continuations after a pullback, while the entry conditions and the expiry are set separately.
Three parts of MACD — one source history
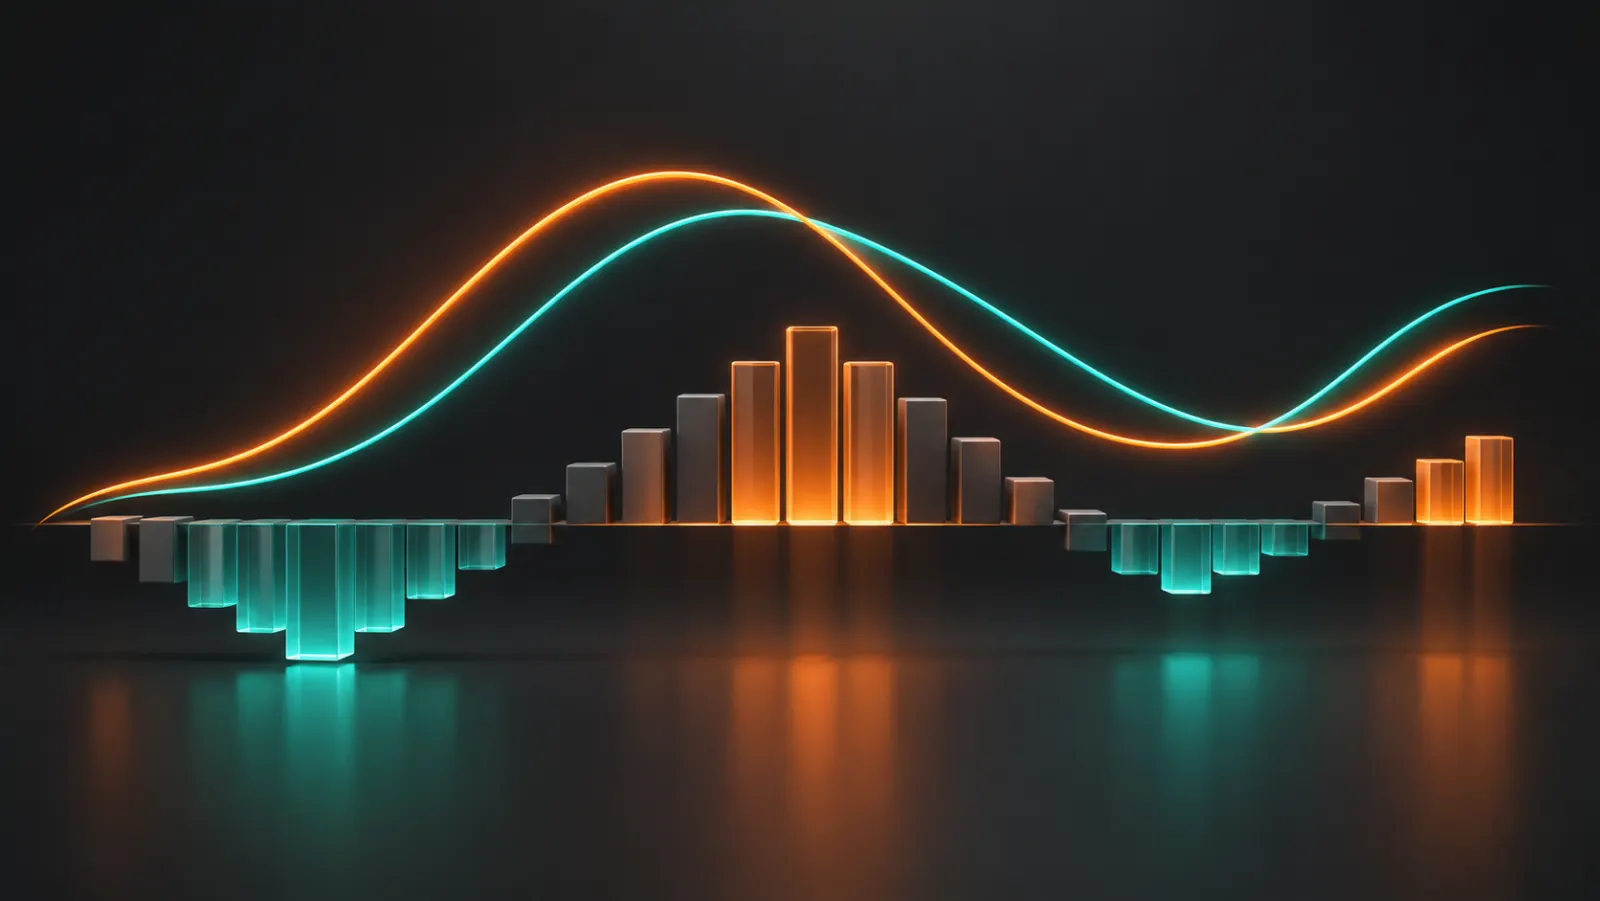
In the common 12, 26, 9 setting, the main MACD line equals EMA 12 minus EMA 26. The signal line is an EMA 9 calculated from MACD itself. The histogram shows the difference between the main and signal lines. The result is three linked views of the same source prices. That makes it easy to read, but it doesn’t mean three independent analysts all agreed with your trade at once.
If the fast EMA is above the slow one, the main line is positive; if below, negative. Its zero means the two averages are equal. The histogram has its own meaning of zero: there, MACD equals the signal line. These events can happen at different times. So the phrase “MACD crossed zero” without specifying which part can lead two people to different points on the same chart.
When you add the indicator, check its algorithm. There are versions with other types of averages, price sources and coloring rules. The 12, 26, 9 setting on its own doesn’t describe everything. For consistent research, write down the type of both averages in the main line, the type of the signal line, the source price and the timeframe. Then any discrepancy with another chart can be traced to specific parameters.
Why the bars shrink while the price rises
Imagine the fast average is 105 and the slow one is 102. MACD comes to 3. The signal line is at 2.2, so the histogram equals 0.8. In the next calculation, both averages have risen, but the difference between them is still 3. With a signal EMA of 9, the weight of the new observation is 2 / (9 + 1) = 0.2. The updated signal line: 2.2 + 0.2 × (3 − 2.2) = 2.36.
The histogram now equals 3 − 2.36 = 0.64. It has shrunk, even though both averages went up. The signal line is simply catching up with the main line. You can’t conclude from this that the next price will necessarily be lower. A bar describes the distance between two calculations; the price can keep rising, stand still or start to pull back. That’s exactly why looking only at bar height isn’t enough.
MACD values are expressed in units of the source price. If the whole series is multiplied by 100, the averages and their differences also grow 100-fold. So a MACD of 100 on one asset can’t be declared stronger than a MACD of 0.001 on a currency pair. Comparing different instruments requires separate normalization. Within a single practice series, it’s simpler to stick to one asset and not change the scale of the question.
Two crossovers that are easy to confuse
When the main line crosses zero, the fast and slow EMAs swap places. A signal-line crossover means MACD has moved to the other side of its own smoothing. The second event can happen while both lines are still below zero. For example, MACD values change successively from −4 to −3 and −2: the gap between the averages is narrowing, but the fast one is still below the slow one.
The mirror situation is possible above zero: MACD stays positive but drops below the signal line. The averages keep their previous order for now, but their difference has changed relative to recent history. This can accompany a slowdown or a pullback. To call it a reversal of the whole structure, you’ll need to look at the price and its completed highs and lows.
The histogram crossing zero and the main line crossing the signal line are one and the same arithmetic event under the same calculation. Don’t count them as two confirmations. Instead, record three separate observations: the sign of the main line, its position relative to the signal line and the state of the price. This short breakdown gives more clarity than a list of matching colored markers.
How to read color and an incomplete bar
Four shades often show positive bars that are growing or shrinking, and negative bars that are deepening or approaching zero. But there’s no universal palette. Green can mean a value above zero or an increase over the previous bar. Look at the numbers first. A change from −0.8 to −0.5 is an increase in value, even though the bar stays in negative territory.
On the current candle, the histogram’s height changes with the price. A crossover appears, disappears and sometimes comes back. A finished historical chart will only keep the final result. For the exercise below, use closed candles: this lets you understand the event the same way when reviewing history and in demo mode. Entering inside a forming candle requires a different data set and a separate test.
It’s also useful to tell a new event from the continuation of an old one. If the main line stays above the signal line for five candles, that’s not five new crossovers. A series of entries on every bar would be a different hypothesis and would increase the number of dependent trades. At the first stage, it’s more convenient to consider one event after a distinct pullback, and to note repeated swings nearby without automatically entering again.
Lag: what MACD manages to see
The indicator is built on averages that use prices already received. When a move begins, the calculation still contains the previous history, and the signal line adds its own layer of smoothing. That’s why MACD rarely marks the very first point of a reversal. It helps describe a change consistently once part of the way has already been covered. Asking it to be both smooth and instantly predictive is a rather generous request to make of a formula.
Shorter periods speed up the reaction and increase sensitivity to short swings. In a range between 100 and 101, the averages can cross constantly while the price moves back and forth. A signal appears at one edge just as the move is already turning toward the other. Faster settings can shift the timing, but they don’t by themselves turn a sideways market into a sustained trend.
So before changing the parameters, ask whether the stretch suited your idea. If you’re testing a continuation after a pullback, chaotic crossovers in a narrow range may be a reason to skip the situation. That filter has to be defined in advance. Excluding all losses in hindsight under the label “bad market” is much easier than reproducing an honest test.
Preparing the chart and the intrade.bar settings
intrade.bar uses TradingView. For analysis, choose MACD with the parameters you need, if it’s available in your set of tools, or do the calculation on a separate TradingView chart. In the second case, match the instrument, the quote provider, the time boundaries and the timeframe in advance. A familiar look doesn’t guarantee identical closes, and the financial result is determined by the quotes of the platform where the option is open.
For this example, let’s fix one available currency pair, M5 and the standard MACD 12, 26, 9 on closes. The periods here refer to bars: switching to an hourly chart changes the meaning of the whole set. Leave enough history for the averages; with different initialization, values in the first visible stretch can diverge. Don’t start a comparison from a single borderline candle.
Then set the amount and expiry of the demo trade separately. MACD 9 doesn’t mean a 9-minute expiry, and M5 doesn’t oblige you to choose 5 minutes. For a practice series, you can test 10 minutes in Sprint, if that expiry is available. Record the payout from the form of each option. These are independent test parameters, not hidden properties of the indicator’s standard setting.
A practice entry after a pullback: step-by-step logic
First, the price should show a completed upward structure: comparable local highs and lows are rising. The main MACD line is above zero. After a pullback, the histogram turns negative, then on a closed candle returns above zero, while the main line stays positive. We’re watching MACD regain its position relative to the signal line within an upward context defined in advance.
Before entering, check the pullback itself. It shouldn’t break the previous low you selected. The price also shouldn’t already be pressing against an upper area marked in advance that your rule excludes. If the conditions are met, on the intrade.bar demo you can test a Call trade at the first available quote after the signal candle closes, with the same notional amount and a preset expiry. Write down the actual price: it may differ from the candle’s close.
Skip the entry if the crossover is still forming, the main line has dropped below zero, the structure is broken or you’re late for the agreed moment. For the downward direction, use a separate mirrored rule in a downward structure. These are practice hypotheses, and their results may turn out unsatisfactory. The value of wording them precisely is that you’ll be able to establish exactly which combination of conditions you tested.
There’s no early closing on intrade.bar. If the histogram turns back a minute later, that doesn’t let you end an already open contract on a MACD signal. The result is determined by the chosen expiry, and exactly equal prices lead to a refund. That’s why it’s especially important to think through the skip rules and the expiry in advance, before the emotionally exciting part starts on the screen.
Reviewing a series instead of judging one arrow
In a separate spreadsheet, save the time, the state of the structure, the sign of MACD, the moment of the crossover, the opening price, the expiry, the amount, the payout and the outcome. intrade.bar statistics will help you separate the demo and real accounts and see breakdowns by asset and expiry; the CSV gives you a history of closed trades. Add the indicator readings and reasons for skipping yourself. You can’t reconstruct them from the final win share alone.
Count the money result. With a notional 80% payout, ten winning and ten losing trades of the same size give minus two trade amounts. If the payout varied, the overall win rate is even less informative without the details. Also note runs of quick repeated crossovers: several events within one sideways episode don’t equal independent observations in different market conditions.
Test the rule on a period chosen in advance, then on the next one without fitting the parameters to a known result. It’s useful to compare it with the same price logic without MACD: did the indicator really change the selection, or did it just add confidence? The intrade.bar demo is a convenient place to start this kind of review. After a few consistent records, the lines and bars will become a clear analytical tool rather than a set of “click now” commands.
Questions and answers
The price is rising, but the MACD histogram is shrinking. Is that an error?
No. The histogram equals the difference between the main and signal lines. The signal line can be approaching the main line while the price keeps rising. The direction of the next candle doesn’t follow from a single shrinking bar.
Do a signal-line crossover and a zero crossover mean the same thing?
Zero on the main line shows that the fast and slow averages are equal. Zero on the histogram shows that MACD and the signal line are equal. The latter coincides with their crossover, while the former is a separate event.
Can I close an intrade.bar option on an opposite MACD signal?
There’s no early closing. You can record the opposite crossover for analysis, but the outcome of an already open trade is determined at the chosen expiry. That’s why the expiry and the acceptable entry conditions are set in advance.
Lakukan transaksi latihan pertama Anda
Akun demo dibuka segera setelah pendaftaran