The price has touched the upper Bollinger Band. “There’s nowhere left to go,” the picture suggests — and that’s exactly where the market sometimes starts doing the most interesting things. The bands don’t limit movement: they are recalculated as the price moves and show its position relative to the average and the spread. So the same contact can accompany a bounce, a trend continuation or an ordinary pause. Let’s go through how Bollinger Bands work and what squeezes and expansions mean, and then build a clear demo test on intrade.bar. What matters in it is the whole scenario — from the state of the market to the exact settlement time of the option.
What the three lines show
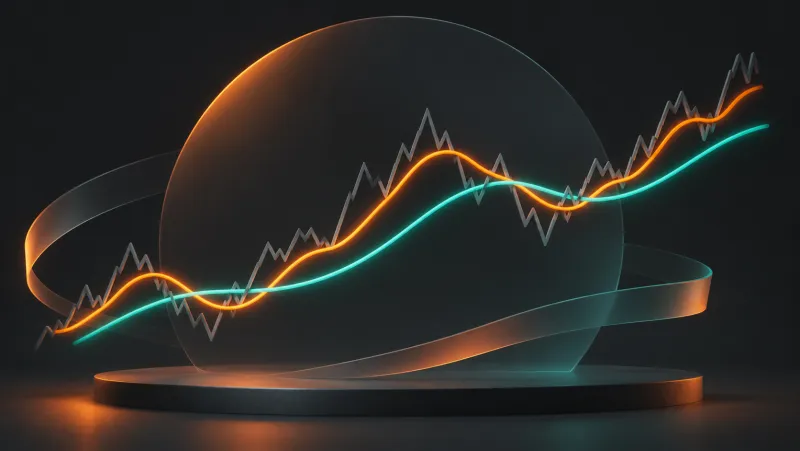
In the traditional version, the middle line is an SMA of the chosen series, usually closes. The upper line sits above it by a set number of standard deviations, and the lower line sits below it by the same amount. A period of 20 and a multiplier of 2 are common. That’s a popular starting point, not ideal parameters discovered by nature. Changing the period, source or multiplier changes the shape of the channel and the set of events at its edges.
The standard deviation describes the spread of prices within the window. When values are packed more tightly, the bands usually draw closer together; when the spread grows, they move apart. The width depends on the whole window, so one calm candle doesn’t have to narrow the channel right after a big impulse. The past move is still part of the calculation, even if the right side of the chart has gone quiet for a minute.
Read the slope of the middle line, the width and the price’s position separately. The middle line can rise while the width stays almost constant; the channel can expand both upward and downward. These properties answer different questions. If you reduce everything to “the bands are pointing up,” it’s easy to lose the key point: whether the price is in a directional move, at the edge of a range or already in a transition.
A simple calculation: from five prices to a channel
Take the closes 98, 99, 100, 101 and 102. The average is 100. The deviations from it are −2, −1, 0, 1, 2; the squares are 4, 1, 0, 1, 4. The sum is 10. If we divide by the number of observations, 5, the variance is 2, and the standard deviation is the square root of 2, about 1.414. With a multiplier of 2, the upper band comes to 102.828 and the lower to 97.172; the distance between them is about 5.657.
In this example, we use a small window for the sake of transparent arithmetic. In another implementation, where the spread is calculated by dividing by n−1, the number will be different. So when carrying settings over between charts, check the calculation method. A similar name and the same period number don’t guarantee that the lines match to the last decimal place.
Now replace the series with 99, 100, 101, 102, 110. The average becomes 102.4, and the standard deviation with the same method is about 3.929. The bands widen to follow the increased spread. They reacted to the 110 that has already appeared. It doesn’t follow that the next price will keep rising or return to 100. The channel describes the updated data; it doesn’t announce the permitted prices of the next candle.
Why touching the upper band isn’t an order to sell
Contact with the upper line means the price is high relative to the chosen average and the current spread. It doesn’t prove that the asset is fundamentally expensive. In a sustained rise, the price can move along the upper boundary for a long time, and the boundary itself will keep rising. In that case, automatically going down after every touch ends up working against the ongoing move again and again.
Distinguish a wick touch, a close outside and a return inside. These are three different events. If you count the first as the signal in a winning example, the second in another, and demand the third after a loss, you’ll get an almost flawless strategy on paper. You just won’t be able to repeat it before knowing the result. Start with one precise definition and count every qualifying case.
A band’s edge doesn’t mean that’s where mandatory opposing orders are sitting. It’s calculated from the price; it doesn’t control it. It’s handy to think of the bands as a coordinate system: you see how far the current stretch has moved from the average. But this map has no barrier saying “no entry above this point.” The market’s actual reaction has to be observed and tested.
Squeeze and expansion: calm isn’t a direction yet
A Bollinger Band squeeze shows a decrease in the spread within the chosen window. It doesn’t say which way the price will go or how many candles from now. Sometimes a strong move begins after a calm stretch; sometimes a narrow range lasts much longer than expected. Picking a direction early just because “the spring is coiled” means adding a forecast that isn’t in the measurement.
The word “narrow” needs a scale. A one-dollar difference means different things at a price of 10 and at 1,000. For relative comparison, BandWidth is used: (upper − lower) / middle, often multiplied by 100%. Even this measure is best compared with the history of the same asset and timeframe. The formula doesn’t set a universal squeeze threshold for all instruments.
If you’re researching breakouts from a squeeze, define both the state itself and the breakout event in advance. For example, the width falls in the lower part of its values over a chosen past sample, and then a closed candle moves beyond the boundary. After that, continuation and return are examined separately. Calling every failed continuation a “false breakout that doesn’t count” after the result is a way of erasing the inconvenient half of the test.
Parameters and the myth of a 95 percent guarantee
A period of 20 on one-minute and hourly candles means different source sequences. The multiplier of 2 sets the distance of the boundaries from the middle line. If you increase it, there will usually be fewer contacts, but the rarity of an event doesn’t equal forecast quality. If you decrease it, you’ll get a tighter channel and a different selection. Change parameters between separate series, keeping the other comparison conditions the same.
Sometimes two sigmas are turned into a promise that the price will almost certainly stay inside the bands. This logic transfers a property of a textbook normal distribution onto a future market price without the necessary assumptions. The window here is limited, the center and width change, and observations are dependent. Besides, “the price is inside the channel” and “after a touch it pays to open an option the other way” are completely different questions.
For a digital option, it isn’t enough that the price eventually returned to the middle line. It may have kept rising for another three minutes first, with the return coming ten minutes later. The outcomes of different expiries will differ. So check the exact entry price and settlement moment. A convenient final screenshot doesn’t show the path the trade took before the nice bounce appeared.
Setting up the exercise on intrade.bar
For a first test, choose an available currency pair, a five-minute chart and standard 20/2 bands on closes. intrade.bar uses TradingView; find the corresponding tool in the available set, or do your analysis on a separate chart. With external analysis, match the quote source, the asset and the time. The result of a trade on the platform is determined by its quotes, not by how the boundary looked in another window.
Mark in advance the horizontal areas between which the price has already moved back and forth several times. This exercise needs a range; narrow bands alone aren’t enough. Fix its lower and upper areas before the signal. If the middle line is steadily sloped, the price is making new highs or lows and moving along one band, the return-within-a-range scenario doesn’t match what you see.
Choose one expiry to test and the same notional amount. For example, for a demo series you can test 10 minutes in Sprint, if available. The five-minute timeframe and the period of 20 don’t set this duration automatically. Before each trade, intrade.bar shows the payout; write it down together with the time. Even the same chart situation can produce different economics at different payouts.
The return-inside-the-bands scenario: conditions and reasons to skip
Consider the practice upward direction. The price reaches the lower area of the range marked in advance and, on a closed candle, ends up below the lower band. Then the next candle closes back inside the channel. The lower area must remain valid according to the rule you adopted in advance; for example, a wick beyond it is allowed, but a close below it isn’t. The result is a precise event that you can mark consistently.
After the confirming candle closes, check the actual available price. The entry should remain in the lower third of the original range — that’s a measurable filter you can fix for this practice series. If the return candle has already covered almost the entire range, the idea is too late, even if the picture looks perfect. On the intrade.bar demo, a Call trade is opened only when the written conditions are met, with a fixed expiry and notional amount.
Skip the situation if the range is broken, the confirmation is still forming, the price keeps closing outside the band several times in a row or you’re late for the entry moment. Also decide in advance which news windows to exclude. For the downward direction, mirror the check: the upper area and a return from beyond the upper band. Keep the results of the two directions separate at first: the same geometry doesn’t prove the same behavior.
intrade.bar has no early closing: a return to the middle line before expiry doesn’t lock in a win by itself. If the price has moved against your direction again by the settlement moment, that moment is what determines the outcome. If the price exactly equals the opening price, the amount is refunded. This nuance is especially important for a strategy whose name tempts you to treat any “return” that happened as a success.
How to evaluate the result without convenient exceptions
In a separate record, save the range, the band parameters, the type of event, the time, the price, the amount, the payout and the expiry. After expiry, add the outcome and a note on whether the conditions were followed. intrade.bar statistics will help you view the demo account, assets and expiries separately, and the CSV lets you reconstruct closed trades. Record the boundaries and reasons for entry yourself: they can’t be reconstructed from the final win rate alone.
Count every qualifying case, including continuations beyond the band and quick returns after which the price turned around again. Several signals within one impulse are dependent; they don’t carry the same information as episodes on different days. If you add a filter after the review, test the new version on the next stretch. Don’t rewrite the results of the old series as if the rule had existed from the start.
The money result matters more than the share of spectacular bounces. With a notional 80% payout and the same amount, 11 wins and 9 losses give 11 × 0.8 − 9 = −0.2 trade amounts. In other words, a 55% win rate isn’t enough in this example. Take actual payouts from your records; account for refunds separately. That way, the test answers a question about a specific option, not just about how pretty the indicator looks.
Where to start
On the intrade.bar demo, first watch three different stretches: a calm range, an expansion after an impulse and a move along a band. Describe the middle line, the width and the price separately. Then test one return scenario with conditions set in advance. A useful outcome of the exercise is being able to explain both an entry and a decision not to enter.
Bollinger Bands are handy because they show the price’s relative position and the change in spread in one window. Once you stop expecting the boundaries to force a reversal, they become easier to read. They help you ask the market precise questions, and testing on the demo shows how well your chosen answers fit the mechanics of a digital option.
Questions and answers
Is touching the lower band a signal to open a Call option?
The touch itself only shows the price’s position. The practice scenario also requires a range marked in advance, a completed return inside the bands, a suitable entry price and a separate test of the chosen expiry.
Does a band squeeze show the direction of the future move?
No. It describes a small spread of prices in the calculation window. The direction and timing of a breakout have to be observed separately; a calm stretch can continue.
If the price has reached the middle line, has the demo trade already won?
No. intrade.bar has no early closing. The result is determined by comparing with the opening price exactly at expiry; touching the middle line along the way doesn’t lock in the outcome.
Place your first practice trade
A demo account opens right after registration