After a confident decline a small candle appears, and the next one sharply recovers the drop. It is very tempting to call it a reversal and open a trade straight away. The morning star and evening star really do help describe such a change in movement, but there are several checks between a recognizable pattern and a ready decision. Let’s break down this three-candle pattern and show how to study it on the intrade.bar chart with conditions and an expiry chosen in advance.
What the three candles tell you
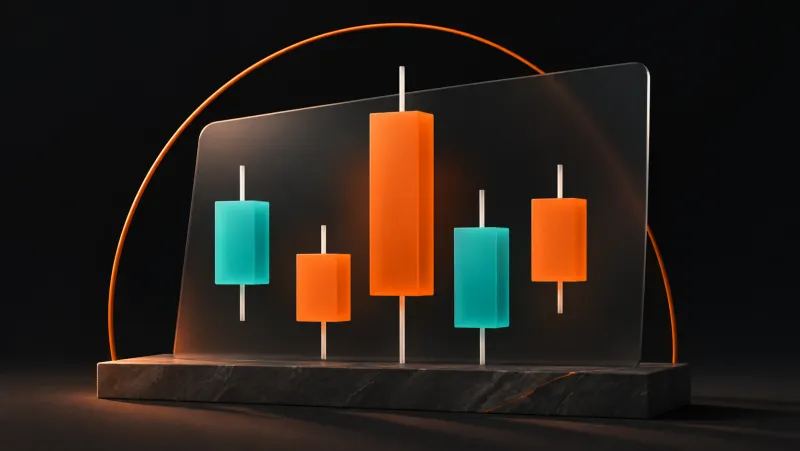
A morning star appears after a decline, an evening star after a rise. The first candle continues the previous direction with a noticeable body, the second has a small body, and the third moves in the opposite direction. Opens and closes matter most; wicks add to the picture of the range, but they don’t replace the relationship between the bodies.
A small middle candle shows that its open and close ended up close to each other. It is not the minutes of a meeting between buyers and sellers: you can’t tell from the shape what they were thinking. The useful observation is more modest: the move stopped advancing at its previous pace on a closing basis, and the third candle showed a response in the other direction.
The words “large” and “small” need a scale. A ten-pip body may stand out on a calm stretch and get lost among wide neighboring candles. For research, choose the comparison in advance: against previous bodies or their average over a set period. If you change the criterion each time to fit a pretty picture, the result will describe your markup, not the pattern.
Morning star: check the midpoint of the first body
First, find the preceding decline. One random red candle is not enough to talk about a reversal structure. Then check the sequence: a pronounced bearish candle, a small second body and a noticeable bullish third candle. In a common strict version, the third close must be above the midpoint of the first candle’s body.
Take sample prices: the first candle opened at 105 and closed at 101. The midpoint of the body is (105 + 101) / 2 = 103. After a small second candle, the third closed at 104, so the required relationship holds. A close at 102 doesn’t meet it, even if the green candle itself looks convincing.
The color of the second candle is secondary: a small body can be either bullish or bearish. A doji is a special case where the open and close are very close. For that combination, the name “morning doji star” is used. If your test distinguishes a small body from a doji, set the boundary in advance and don’t lump the results together without sorting them.
The evening star reads as a mirror image
After a rise, the first candle continues upward, the second has a small body, and the third closes with a noticeable drop. In the strict version, its close is below the midpoint of the first candle’s body. That way you see a give-back of part of the rise that has already happened, not just a hope that the market is tired of climbing.
If the first candle opened at 100 and closed at 104, the midpoint of its body is 102. A third close at 101 satisfies the chosen rule; at 103 it doesn’t. It is specifically the body’s midpoint that matters here. If you take the whole range including long wicks, you get a different value and possibly a different classification of the same combination.
The mirror geometry is convenient for learning, but it doesn’t prove that the two patterns perform equally well. Rises and declines of a particular asset can happen under different conditions. So in your research, keep a separate mark for direction and compare the results on data. A similar silhouette is not ready-made statistics.
Gaps: the classic star and the intraday version
In the classic description, the small body of the second candle is separated from the first by a gap: below it for a morning star and above it for an evening star. Some strict definitions also require a gap before the third candle. It is this arrangement that makes the middle candle look like a star standing on its own.
On a continuous intraday currency chart, a new candle often opens right next to the previous close. Fully separated bodies occur differently than on daily charts of instruments with trading breaks. That is why Forex traders often study an adapted combination without a mandatory gap. Call it exactly that: the criterion has been changed, so a separate version is being tested.
If a ready-made indicator marks a star where you don’t see one, compare the rules first. The algorithm may define a small body, a trend or a gap differently. The marker tells you its conditions are met, not the probability of future profit. Before using it, also find out when it appears and whether it can change on an unfinished candle.
Context: where the pattern is worth testing
Three similar candles in the middle of a narrow sideways range don’t mean the same thing as after a directional move. For a reversal hypothesis, you first need to define what exactly is supposed to reverse. You can describe in advance a sequence of falling or rising extremes on the chosen scale and apply one rule in every case.
A support or resistance zone adds context if you marked it before the pattern appeared. For example, for a morning star you study a decline stalling at a previously marked zone. It is much easier to draw support through the low of an example that already worked, but such a line could not have helped at the moment of the decision.
Also look at the distance to the opposite zone. If, after the third candle, the price has already reached the nearest resistance, the actual situation differs from the original idea of buying at support. This can be a reason to skip that you defined in advance. There is no need to force every pattern you find to become a trade.
Finally, take events and scale into account. A three-candle local turn can remain part of a larger trend. During a data release, a wide third candle may reflect sharp new information. If such conditions were not part of your test, nice geometry is not enough to consider them studied.
Why you need to wait for the third candle
While a candle is forming, its color, body and wicks keep changing. A minute before the close it may be past the midpoint of the first body, and by the end it may come back. If the rule requires a completed star, decisions before the close belong to a different hypothesis: an attempt to predict that it will form.
Waiting has a clear cost: the entry will be later and at a different quote. But you can’t both rely on the confirmation of the third close and assume you entered at a better price inside that candle. On historical data this combination looks tempting; in real time it requires knowing the future.
On a five-minute chart, the pattern takes fifteen minutes to form. That doesn’t mean the next trade must last fifteen, five or one minute. The timeframe describes how candles are built; the expiry is the moment your forecast is checked. With a digital option, the price may first move against your entry and then continue the expected reversal; different expiries will give different outcomes.
A practice scenario on intrade.bar
Start on a demo account with one available currency pair and a five-minute TradingView chart. Before watching, mark the zone and write down which version of the star you are studying. For an intraday practice example, you can choose the adapted pattern without a gap: the first candle is noticeable compared with previous bodies, the second is smaller than the first by a ratio set in advance, and the third closes beyond the midpoint of the first body.
Suppose you are studying a morning star after a decline at support. Wait for the third close, then check all the criteria, the price’s position relative to the nearest resistance and the absence of an excluded news period. At this stage the pattern either meets the rules or remains a look-alike combination. A subsequent rise must not fix a missing condition after the fact.
As a separate practice parameter, choose a 10-minute duration in Sprint in advance and the same amount for all qualifying observations. This is a hypothesis to test, not an optimal expiry derived from the pattern. Before entering, make sure the required duration is available and the percentage shown matches your test conditions. Record the actual opening price: it may differ from the close of the third candle.
If the price has already moved far, the required expiry is unavailable or you can’t classify the pattern unambiguously, skip the trade and record the reason. intrade.bar has no early closing, so you can’t pick an unsuitable expiry planning to exit earlier. For an evening star, apply the mirror sequence of checks for a Put, keeping the same order of decision-making.
After expiry, record the result according to the contract terms. If the quotes are equal, intrade.bar refunds the trade amount. Don’t replace the result of a ten-minute contract with a story about how the price did reverse an hour later. Your research tests a specific entry and expiry, not the beauty of the subsequent move.
How to tell what the test showed
Collect every case that fits your chosen rules: wins, losses, refunds and skips. Note the reason for each skip, the pattern version, direction, time and percentage. On intrade.bar you can separate demo and real results, look at assets and expiries, and export closed trades to CSV. Add the star criteria and the reasons for decisions in separate notes.
Don’t stop at WinRate. With a notional 85% payout and equal amounts with no extra costs, the break-even point is about 54.05% of winning and losing trades. With a different percentage, the threshold changes. A short winning streak doesn’t prove that the pattern itself created an edge: test the rule on new observations without re-tuning it.
If the pattern disappears when you switch to another chart, compare the symbol, data source and candle boundaries. Different hourly intervals can change opens and closes even when the market moves similarly. So it is better to start with one source and one markup scheme rather than collecting convenient examples from several incomparable series.
A first useful exercise on intrade.bar is to find several completed combinations and explain why each one does or doesn’t fit your definition. Then move on to sequential demo testing. That way the morning and evening star become a working language of analysis: you know what you saw, what you waited for and why you chose a specific action.
Questions and answers
Does the middle of a star have to be a doji?
No. In the general pattern, the middle candle has a small body. A doji is a separate special case. Size criteria should be defined before testing so that identical candles don’t get different names depending on the final result.
Can I use a morning star without a gap?
On an intraday currency chart, you can study an adapted combination without a mandatory gap. State this in your rules and don’t mix its statistics with the strict classic pattern.
What expiry should I choose after a star on intrade.bar?
The name of the pattern doesn’t set the expiry. Choose and test a specific duration separately, then match it to the conditions available in the terminal. The ten minutes in this article’s example are a practice parameter, not a recommendation for the best expiry.
Place your first practice trade
A demo account opens right after registration