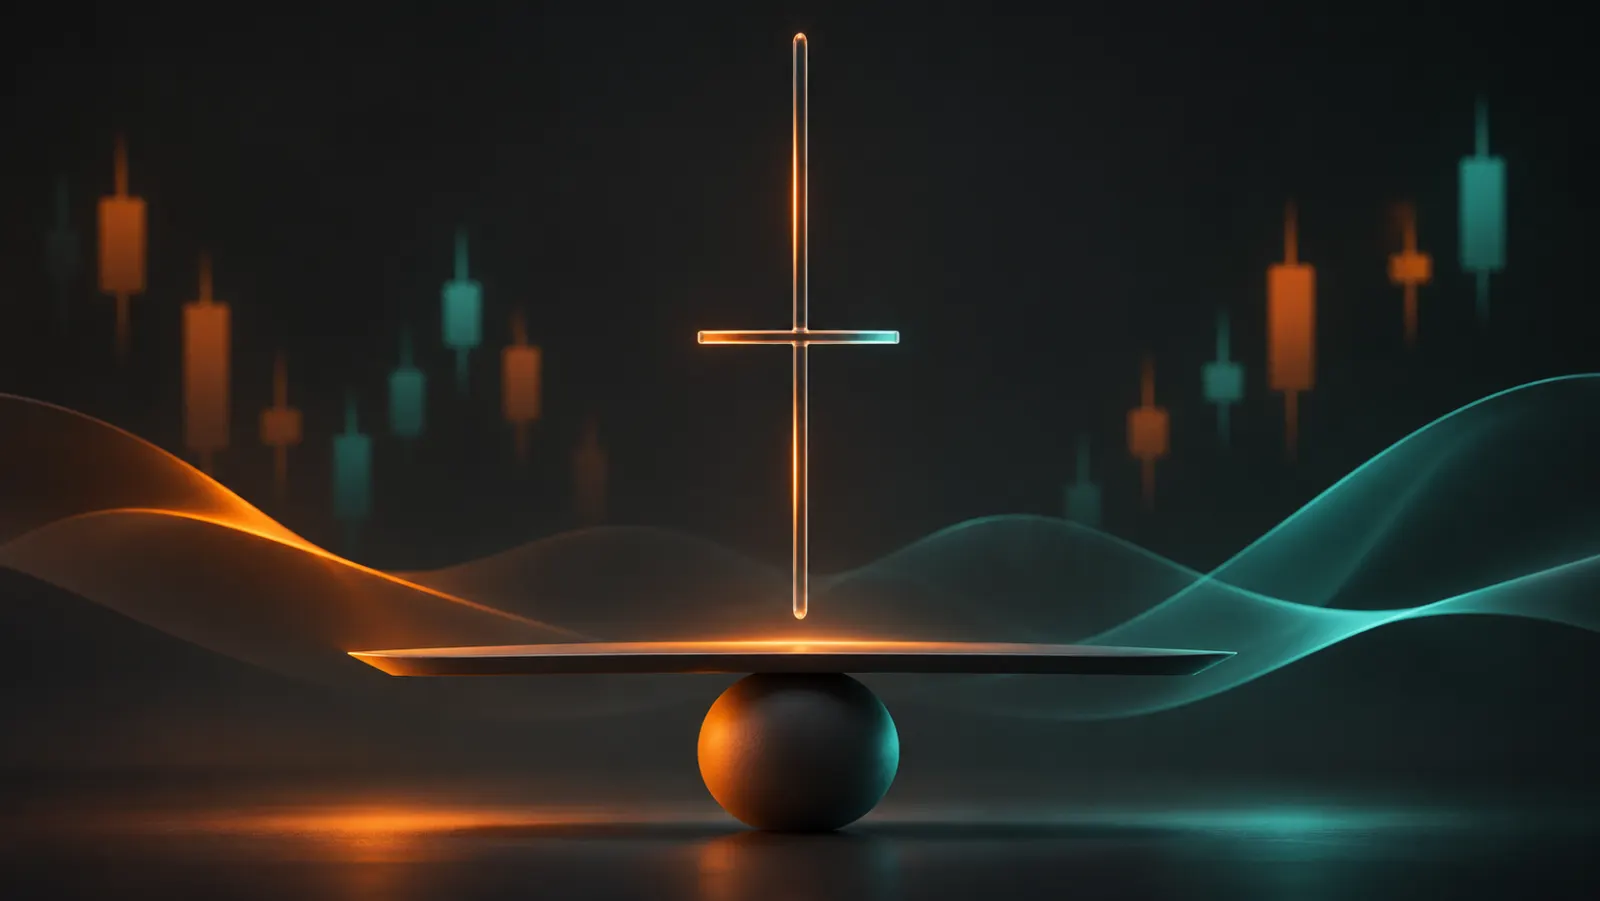
A neat cross appears on the chart. Your hand is already reaching for the button, because “a doji means a reversal.” A few seconds later the cross is gone, the candle has grown long, and your confidence has gone with it. For a doji candle to be useful, you need to separate its shape from the trading decision. Let’s go through the varieties, the context and a concrete procedure for a practice check on intrade.bar: which candle qualifies, what to wait for, when to skip an entry and how to evaluate the result.
What a small body shows
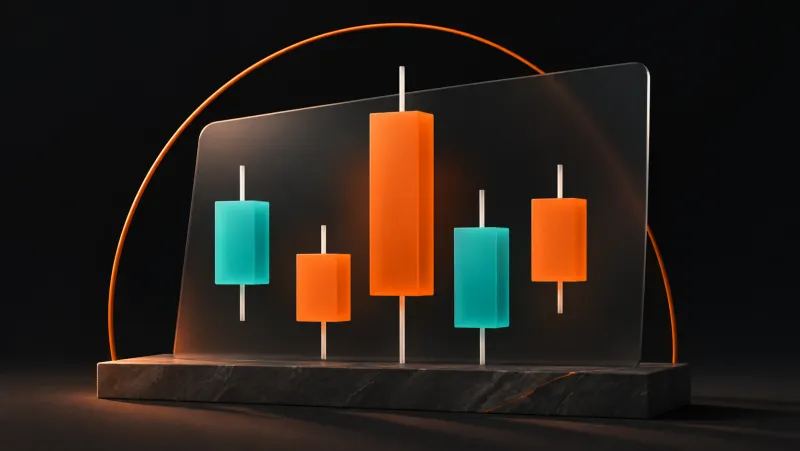
A candle’s body is the distance between the opening and closing prices. The full range is the distance from the low to the high. A doji has no body, or a very small one relative to the range: the price ended the interval roughly where it started. Within that interval, though, it may have traveled a considerable distance in both directions.
Imagine an open of 100.00, a close of 100.02, a low of 99.50 and a high of 100.50. The body is 0.02, the range 1.00, and the body’s share 2%. This is a clear doji by the criterion of nearly matching prices. The 2% figure describes the example, not a mandatory standard for all assets and timeframes.
For a consistent search, define in advance what you consider a small body. In a practice sample, you can choose an upper limit for its share of the range and a minimum non-zero range. Then apply the same rule to every candle. If the range is zero, you cannot divide by it; such an interval has to be considered separately.
Absolute size matters too. The same difference between open and close can be almost invisible inside a wide candle and take up half of a narrow one. Besides, on-screen rounding can hide a small body. For precise measurements, look at the OHLC values, not just the thickness of the line at the current chart zoom.
Standard doji, dragonfly and gravestone
In a standard cross-shaped doji, the small body sits inside the range, with shadows visible on both sides. The long-legged version stands out for its prominent upper and lower shadows. It shows a large range covered with a small net change, but it does not tell you which way the price will go next.
In a dragonfly, the open and close are near the top of the candle, and a long shadow points down. A gravestone is the mirror image: the body at the bottom, the shadow pointing up. The names are quick to memorize; turning them into “buy” and “sell” commands is not a good idea. The geometry describes a finished interval, while the direction of the next trade needs a separate reason.
A four-price doji looks almost like a horizontal dash: the open, high, low and close coincide or barely differ. Before interpreting it, check the activity and whether the data is updating. An interval with no noticeable movement may contain no useful signal, even if its name sounds especially mysterious.
What hides inside a single candle
Take an open of 100, a high of 103, a low of 97 and a close of 100. These values do not show what happened first: the rise to 103 or the fall to 97. Several swings between the extremes are also possible. A single candle compresses the story rather than replaying it in full.
So the story “buyers attacked, sellers fought back” is a handy metaphor, not a record of what specific participants did. If the order of moves matters for your hypothesis, you will need more detailed data. Four prices cannot reliably reconstruct every event within the interval.
Identical dojis can appear after news, calm fluctuations or a brief burst of activity. Before deciding, look at the neighboring candles and the scale of the range. A big candle with a tiny body and a tiny candle with the same body-to-range ratio are different situations when it comes to timing and acceptable risk.
Context: where the cross appeared
After several directional candles, a doji marks a pause in the net price change. That is a reason to look at the movement more closely, but the pause can end in a continuation of the trend, a pullback or a sideways stretch. The market is not obliged to reverse just because you have finally managed to recognize the pattern.
In the middle of an existing range, a small body is often just an ordinary part of the fluctuations. A more meaningful question is whether the doji appeared near a boundary marked in advance and whether its range differs from its neighbors. The description “at support after a decline” can be checked on the chart; “a strong reversal sign” already contains an extra assumption.
Mark support or resistance before the pattern appears. If you first see a dragonfly and then draw a line through its low, you get one observation under two names. Markup saved in advance helps you honestly see both the successful reactions and the cases where the price went straight through the chosen zone.
Wait for the interval to close
On the current candle, the last price temporarily plays the role of the close. The body and shadows keep changing until the interval ends. What looked like a doji twenty seconds before the close may end up as an ordinary directional candle. The history will then show the final shape, and that in itself does not mean past data was changed.
On the TradingView chart in intrade.bar you can make a simple observation without trading: choose a timeframe, note the moment a doji-like shape appears and wait for the close. Compare the intermediate state with the final one. A few such observations explain well why rules based on closed candles cannot quietly be applied to a picture that is still moving.
Timeframe and expiry are different settings. A doji on the five-minute chart describes the past five minutes. It does not automatically determine a good contract term. If you enter after additional confirmation, both the price and the starting moment of the trade change as well.
A practice scenario on intrade.bar
Choose one available currency pair and the five-minute chart. Before a new candle appears, mark the lower boundary of a clear range. For the exercise, set a doji criterion in advance, for example a body of no more than 10% of a non-zero range. This is a rule for selecting practice cases, not a proven optimal threshold.
A candidate appears if a closed doji touches the zone marked in advance after a decline. Set the confirmation separately: the next completed candle closes above the doji’s high. If it closes inside the doji’s range or below it, the practice entry is not made. You cannot swap the confirmation for another, more convenient event after seeing the result.
If the condition is met, open only a practice “Call” trade on the demo with an equal amount chosen in advance. For this experiment you can fix a ten-minute Sprint duration if it is available in the form. Write down the exact expiry and the percentage shown. The term is chosen to test the hypothesis; whether it is suitable remains to be researched.
The actual entry price matters more than a nice point on the picture. After the confirming candle, the market may already have risen noticeably. Don’t calculate the result as if you had entered at the doji’s low or its close. On intrade.bar, take the price from the practice trade record and compare it with the settlement price at that trade’s own expiry.
When to skip this scenario
Skip the case if the zone was drawn after the pattern appeared, the candle has not closed yet or the context does not match your written rule. Also, don’t swap the chosen pair for another just because the first one has gone a long time without a signal. That would be a new sample with different conditions, to be counted separately.
Don’t chase the price if you missed the intended entry moment. A late trade has a different reference point. You can allow a specific time for execution in advance, but you cannot change it every time to suit a chart you like. A note saying “there was a signal, entry missed” is more honest than an artificially perfect trade on historical data.
Before entering, also check the amount, the available percentage and your personal risk budget. With a voluntarily set daily limit on intrade.bar, new trades will not open once the limit is reached. A strong impression from a pattern does not change this condition and does not make the next forecast special.
How to tell whether confirmation helps
Record all qualifying cases under the chosen rule: wins, losses, refunds and skips. Keep the reasons for skipping and the screenshots in separate notes. In intrade.bar statistics you can view results by asset and expiry, and use the CSV export to match closed trades with your notes.
If you want to compare a version with confirmation and one without, those are two separate hypotheses. Each needs its own actual entry prices and identically defined terms. You cannot take the late confirmation from one version and the more favorable early entry from the other. Such a hybrid easily wins on paper and does not exist in real time.
Take the payout into account. At a notional 85%, an equal winning trade brings in less than a losing one takes away; the share of correct directions alone is not enough without a money calculation. Changes in the percentage or amount between trades also affect the total and must stay in the record.
Test the small-body threshold without curve-fitting too. If after the first series you decide to compare 5% and 10% of the range, keep the original results and run the next check on both variants, written down in advance. Don’t remove losing candles after the fact on the grounds that “it wasn’t a good enough doji.” What matters is seeing how robust the conclusion is to a reasonable change in the definition, not finding the one setting that happens to explain the past. Also mark a new pair, a different timeframe or another term as a change in conditions.
After the first series, check reproducibility above all: do you find patterns, zones and confirmations the same way every time, and do you avoid changing the rules after a loss? A short trial mode lets you master the procedure, but it does not replace lengthy testing on different stretches of the chart. Start with a clear scenario and the demo: then the doji becomes a useful object of analysis rather than a reason to press the button at every cross.
Questions and answers
Does a doji always mean a reversal?
No. It shows that the open and close were close together over the past interval. Any further movement is assessed by context and a rule tested in advance; the name itself does not choose the direction.
How do I tell a doji from a spinning top?
A spinning top has a small but noticeable body; a doji has none, or a very small one by the chosen criterion. For research, define the boundary in advance and apply it to every example, including the losing ones.
Does the color of the small body matter?
The color shows a slight edge of the close over the open or the other way around. With an almost zero body, it does not by itself give the direction of the next trade. The pattern’s position, its scale and the conditions of the specific test matter more.
Which expiry should I choose after a doji on intrade.bar?
No ready-made term follows from the candle’s shape. Set the horizon of a separate hypothesis, choose the matching available value and test actual entries on the demo. The candle’s timeframe and the contract term are not automatically the same.
Birinchi oʻquv bitimini bajaring
Demo hisob roʻyxatdan oʻtgandan keyin darhol ochiladi