Sometimes a chart is marked up so thoroughly that the price physically can’t avoid touching one level or another. After any move, there is always a line that “predicted everything.” Support and resistance become useful earlier than that: you mark the area before the price gets there, describe the reaction you expect and decide what will cancel the scenario. Let’s walk through this process with clear examples and carry it over to practice on intrade.bar — without dozens of unnecessary lines and without trading every touch.
What support and resistance are
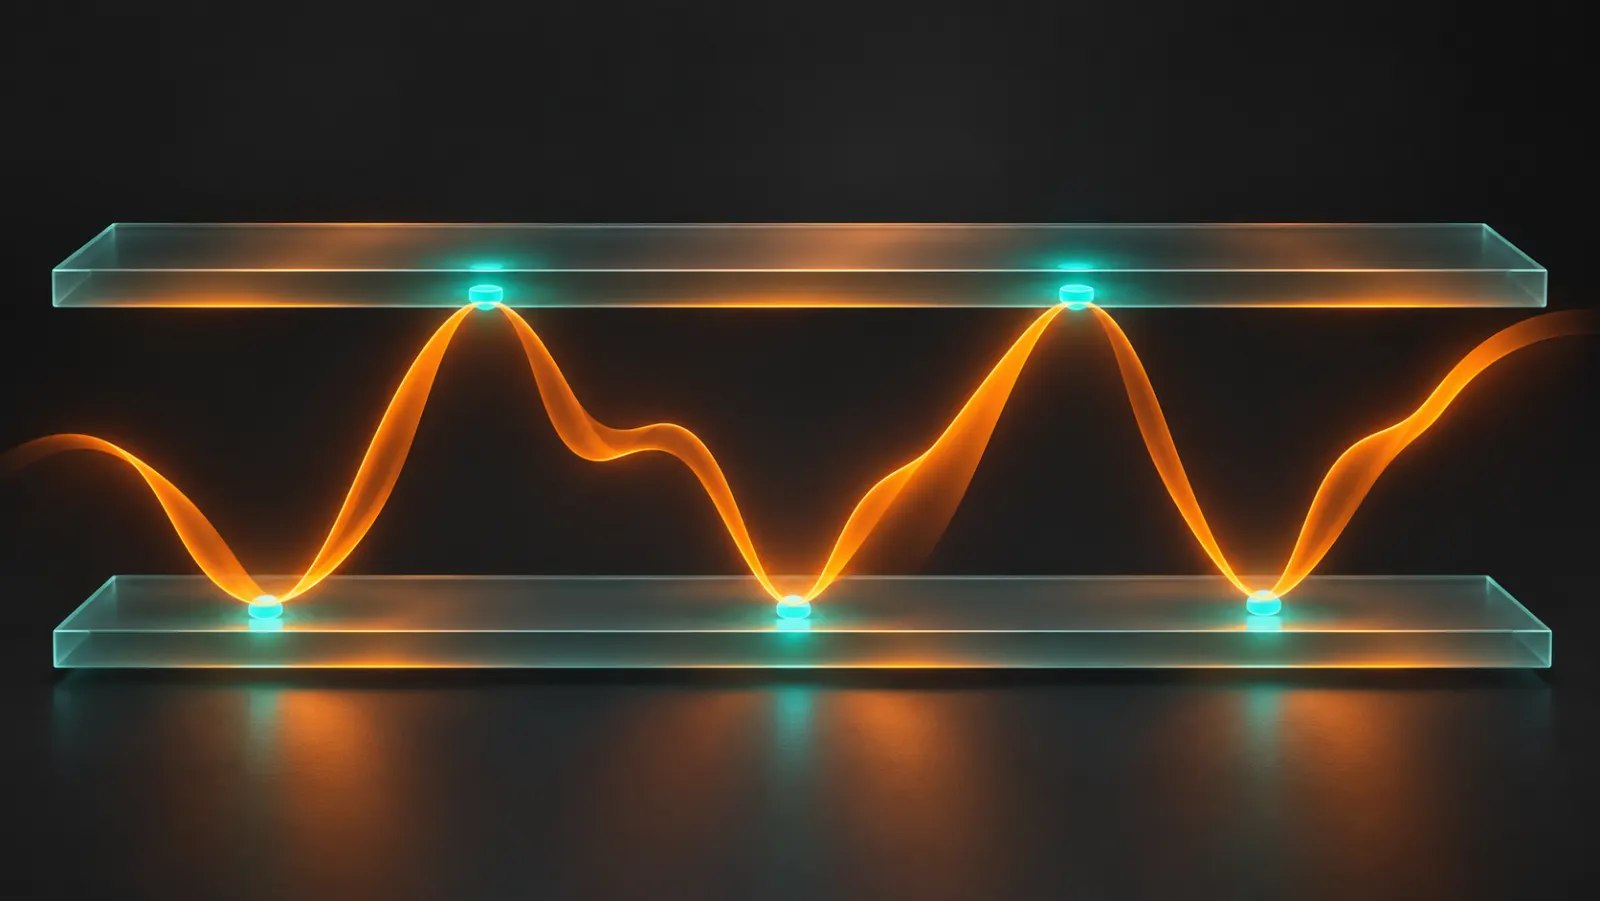
Support is an area where a previous decline slowed down, stopped or turned into a rise. Resistance is an area where a price increase met a noticeable reaction. Zones are usually drawn from swing highs and lows and from the boundaries of ranges. They help you decide where to pay attention, but they don’t put a physical barrier in the market’s way.
The same area can be called different things depending on where the price is. After a break above resistance, traders often watch for a return to it from above. A possible switch to the role of support is a scenario to be tested. The breakout itself doesn’t prove that the price will bounce on the next approach.
Explain your reasoning with simple observations: “the decline ended here twice,” “this is the upper boundary of the previous range.” A phrase like “big money is sitting at this level” requires data that an ordinary candlestick picture doesn’t provide. For useful markup, what you can actually see is enough.
Why a zone is more practical than a perfect line
Three practice lows sit near 99.8, 100.0 and 100.2. Instead of trying to pick a single magic price, you can mark the area 99.8–100.2 with a center at 100. Then it’s clear in advance what counts as entering the zone and what counts as moving through below it.
A small spread is natural: different approaches have different speeds and amplitudes, and quotes and chart scaling also affect the picture. Expecting an exact touch of one price can make a rule overly sensitive. But an endlessly wide band is no better: it will start to explain almost any move.
Set the width from the observations you selected and keep it until the test is over. If you stretch the area lower after a failed pass, the error only disappears from the drawing. For your statistics, it’s an important event that must stay in the record. You can revise a zone, but the new version should be marked as new.
Choose your timeframe before you draw
On an hourly chart, a small pullback can contain several separate swings on the one-minute chart. If you mix their highs and lows, you end up with lots of formally justified marks and no clear priority. So first decide on your working timeframe and the stretch of history relevant to your task.
For an exercise, you can take a five-minute chart and an observation window chosen in advance, such as the last few hours. Then look at a wider stretch to see whether the price is in a trend or a range. Don’t carry every old line into your working window: keep the nearest areas that help you tell specific scenarios apart.
Label where each zone comes from: “local lows,” “upper boundary of yesterday’s range,” “hourly high area.” These reasons aren’t equally strong just because the rectangles are the same color. When comparing results, group each type of markup separately.
For a digital contract, the timeframe you analyze doesn’t automatically set the expiry. The price can interact with an hourly area far longer than a short expiry lasts. Getting the direction right over the next hour doesn’t guarantee a winning trade in five minutes. That’s why the time horizon of the test has to be written down separately.
Markup in four clear steps
First, find noticeable highs and lows from which the price moved a distance that stands out among the neighboring swings. For a practice rule, you can define in advance how to pick them, for example a low below the lows of several neighboring closed candles. What matters is that the criterion doesn’t change after you’ve seen the future.
Next, group nearby reactions into areas. If the points are far apart, don’t stretch one zone just to get a nice number of touches. They may be different parts of the structure. For a first exercise, a few explainable areas are usually more useful than a detailed map of the whole screen.
After that, keep the nearest zones above and below the current price. Distant reference points can be kept in a separate wide-angle view. Finally, write down the boundaries and the time of the markup, or take a screenshot before the next approach. This simple record lets you notice when you’ve started moving lines to fit the explanation you want.
If you use the TradingView chart on intrade.bar, tie your markup to the selected asset and timeframe. Switching pairs doesn’t carry over the meaning of old marks. The quote source matters too: an exact boundary level may look slightly different on another feed, so test the method on comparable data.
A touch and a reaction are different events
A touch can mean a wick entering the area, a close inside it or a pass through the center price. These are different rules. Choose one before you observe. Otherwise a lucky approach will be counted as a touch, while an unlucky entry into the same area will be dismissed as not precise enough.
The reaction needs a definition too. A small candle of the opposite color doesn’t yet mean a useful bounce. For a test, you can watch for a close above the upper boundary of support, a move of a set size or the price’s position after a chosen time. Each definition answers its own question and needs its own record of the result.
The price can touch support, rise a little and then break lower. On a small timeframe there was a reaction, but a digital trade settling later could still have lost. So the phrase “the level worked” without an expiry and an entry point says almost nothing about the money outcome.
A practice support scenario on intrade.bar
Open the intrade.bar demo, choose one available currency pair and a five-minute chart. Before the next approach, mark support based on several separate earlier reactions. For this practice example, define a touch as a candle’s low landing inside the zone, and confirmation as that candle closing above the upper boundary.
If the candle closes inside the area, the practice condition hasn’t been met yet. If it closes below the lower boundary, the original bounce scenario is cancelled. Don’t widen the support or rename the break a “particularly strong test” just to get a trade. Write down exactly what happened and move on to the next observation.
If the condition is met, you can test a practice Call trade with the same amount chosen in advance. For a first experiment, also fix a duration, for example a ten-minute Sprint from the available options. This is a test horizon, not a promise of the optimal expiry. Before entering, check the payout and the exact settlement time.
Write down the actual opening price. It may differ from the close of the confirming candle, especially if you hesitated for a while. The intrade.bar result is determined relative to the trade’s own entry, not relative to the center of the support zone. The convenience of working on one platform here is that you can immediately match an observation on the chart with the record of a specific practice trade.
When a touch is better left as an observation
Skip the setup if the zone boundaries were drawn in hindsight, the preceding move is unclear or the price has already moved far from the planned moment of action. For your research, these are full-fledged records, not missed opportunities. You can’t improve the report by adding an imaginary entry at a price you never got.
Decide separately what counts as a new approach. Five adjacent candles at one boundary may be a single episode, not five independent confirmations. Opening a trade on each of them increases your total risk and distorts the number of observations. For a first practice rule, it’s convenient to limit yourself to one trade per predefined episode.
Keep your personal budget and the amounts already in open trades in mind. When intrade.bar risk management is enabled, the daily limit adds a further cap on new trades. But choosing how many attempts to make on one zone remains your part of the plan. Several clicks on the same scenario don’t turn into several independent ideas.
If the zone breaks, the scenario changes
A brief wick beyond the area, a close past it and a sustained move further are different events. First describe which one happened, then decide what it means for your chosen rule. You can’t treat every crossing as a true breakout or every return as a guaranteed false breakout.
After support breaks, you may watch for a return to it from below, but that’s a different scenario with its own conditions. Don’t automatically open the opposite trade just because the first scenario failed. Researching bounces and breakouts takes separate records and testing against their own criteria.
Keep the original markup, at least in your notes. Then a later revision won’t erase the failure, and you’ll be able to see which zones turned out to be useless. The goal of analysis is to improve how you observe, not to collect an album of flawless forecasts drawn after the move.
How to check that your markup actually helps
On a historical stretch, temporarily hide the future, mark the zones and move forward in equal steps. Record every approach, including those with no reaction. Repeat the exercise some time later without the old drawing. If the areas change radically each time, your criteria are still too loose.
On the intrade.bar demo, match your notes against closed trades and the CSV export. Statistics by asset and expiry help you see what the sample is made of, but they don’t record your zones and reasons for entry automatically. You need to add that information to your own notes. Back up your win rate with amounts and actual payouts.
Test the method on different stretches, not just in a convenient sideways market. If a small change in the boundaries completely changes the result, the rule may be too sensitive. That’s a reason to refine the process, not to endlessly adjust the zone’s thickness. Start with one pair, a few clear areas and a repeatable demo scenario: that way, the lines on the chart become working reference points, not decoration.
Questions and answers
How many touches make a level strong?
There’s no universal number. Separate reactions help you outline an area, but adjacent candles from one approach aren’t necessarily independent tests. The significance of the number of touches has to be tested within a specific rule.
Is it better to draw support from the wicks or from the bodies?
Both methods are used, but you can’t pick the convenient one after seeing the result. Decide in advance which points define the area and what counts as breaking it. Then apply the rule the same way to every example.
Does resistance always become support after a breakout?
No. It’s a possible scenario if the price later comes back. To act, you need to see the event your rule calls for, rather than treating the role reversal as automatic.
Can I open an intrade.bar trade right at the touch?
That’s a separate hypothesis that needs to be tested. This article suggests a practice rule with a candle closing beyond the zone boundary. For any variant, the actual entry, expiry, amount and skip conditions are set separately.
Place your first practice trade
A demo account opens right after registration