Price has made a new low, but RSI has declined to follow suit. That is what bullish divergence looks like — a situation where price and an indicator move in different directions. Your hand is already reaching for the “Call” button, but there are a few important steps between a pretty picture and a sensible trade. Let’s look at which points to compare, why a signal sometimes appears after the fact, and how to test divergence on an intrade.bar demo account, deciding on the entry, the expiry and the reason to skip a trade in advance.
What divergence shows
Candles and an indicator describe the same market in different ways. Price shows where trades took place, or where the chosen source quoted. RSI transforms changes in closing prices; MACD compares moving averages. When price sets a new extreme, the indicator does not have to reach a new high or low of its own: the speed and sequence of the move may have changed.
Imagine a fall from 110 to 100. After a bounce to 104, price slowly drifts down to 98. The second low is lower, but the last decline is gentler than the first. RSI may reflect this with a higher low. This mismatch helps you notice a change in momentum. It does not yet tell you whether the selling is over: the market is perfectly capable of pausing and then continuing to fall.
So keep three events apart: a divergence has appeared, the price structure has changed, and your entry condition has been met. These are different moments. When all three are called by one word, “signal,” it is easy to open a trade before there are any real grounds — grounds that later look so convincing on a finished chart.
Bullish and bearish divergence in plain numbers
Regular bullish divergence is drawn on lows. On the second move, price drops below the first low, while the corresponding indicator low ends up higher. In the training illustration, price goes from 100 to 98 and RSI from 25 to 32. The number 32 here is an indicator value, not the probability of a rise.
Regular bearish divergence is the mirror image. Price makes highs of 100 and 104, while RSI reads 75 and 66 on the corresponding waves. There is a new price high but no new momentum high. That is a reason to take a closer look at buying near the top of the move, especially if price is already approaching a previously noticeable resistance zone.
The numbers in these examples are hypothetical. Their job is to explain a shape you can learn to recognize on your own. After a divergence, the market may reverse, move sideways or continue the previous trend. For a digital option, the difference is crucial: you need to check the price at a specific expiry, not at some point after the pattern appears.
Which extremes to connect
First find two consecutive price waves, then look at the indicator over the corresponding time periods. Don’t take an RSI low from a neighboring move just because it makes the line look more dramatic. Both ends of the comparison must belong to the same waves as the price points.
For a training test, you can treat a low as confirmed if it is below the lows of the two candles to its left and the two to its right. This is not “the best setting,” just a clear rule. It immediately shows the cost of certainty: until the two candles on the right have closed, you do not yet know that the chosen point meets this definition.
Decide in advance whether you use wicks or candle closes, which indicator period you have chosen and how many candles may separate the two extremes. If you compare wicks today and closes tomorrow, and then swap RSI 14 for RSI 7 after a loss, you end up with a collection of different ideas. Lumping them together into the statistics of one strategy would be dishonest — above all to yourself.
Nearly equal extremes also need a decision before you enter. You can count only a strict new extreme or set a small numeric tolerance. The angle of the drawn diagonal is useless here: stretch the chart window and a “weak” divergence suddenly becomes dramatic. The market won’t even notice your design choice.
When the signal actually became known
An automatic indicator may place an arrow at a historical low even though it recognized that low later. With the two-candles-to-the-right rule, the mark is tied to the old point, but the information only becomes available after both following candles have closed. In such a test, you cannot count an entry at the price of the trough itself.
Suppose the low belongs to a five-minute candle that opened at 10:00. It closes at 10:05. The next two candles finish at 10:10 and 10:15; only then is the chosen confirmation condition met. Your journal should say 10:15. A perfect entry at 10:00 would be using future data, even if the software kindly drew the arrow right there.
An unclosed candle sets another trap. While price is moving, RSI moves with it, and the divergence may disappear. For a first study, it is simpler to work with closed candles. If you want to study intra-candle signals, you will have to record them in real time: a finished historical chart does not keep all the versions that vanished.
Regular and hidden divergence do different jobs
In hidden bullish divergence, price leaves a higher low while the indicator leaves a lower one. In hidden bearish divergence, price makes a lower high while the indicator makes a higher one. These combinations are usually studied as a possible continuation of a move that is already under way. Regular divergence is more often seen as a warning that the current momentum is weakening.
Before picking a name, describe the chart itself: are the lows rising or falling, where is the latest peak, is price inside a range or at its edge? This description is more useful than trying to find some kind of divergence in every stretch of the chart. To start, choose one type and test it on its own: fewer variants mean fewer chances to quietly change the rules.
RSI, MACD and the choice of data
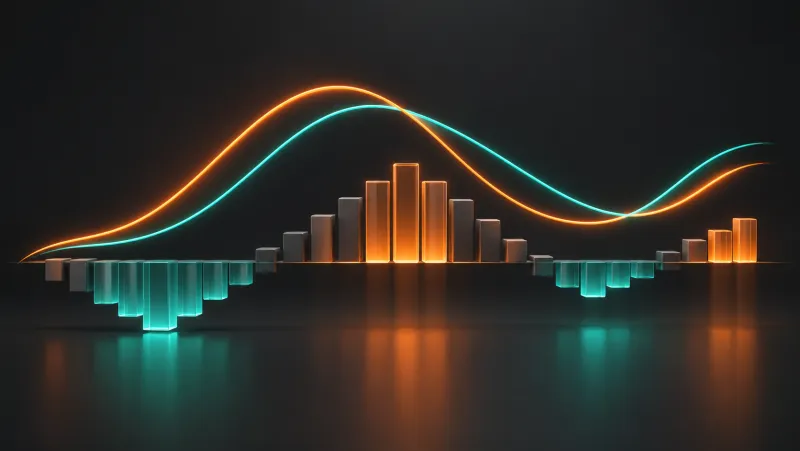
With RSI, you compare the extremes of the line. With MACD, you need to specify exactly what you are using: the MACD line or the histogram. The histogram’s peak may occur on a different candle and describe a different change than the line’s peak. A note that says “entry on MACD divergence” without this detail cannot yet be reproduced.
Two indicators do not become two independent witnesses either: both use related price information. If you add MACD to RSI, test the result of the combination, including the cases where they disagree. The sheer number of confirmations does not give you the right to multiply your assumed probability of success.
To apply this on intrade.bar, start with the chart of your chosen asset. If you do the analysis in an external TradingView, match the instrument, the timeframe and the quote source. For currency instruments intrade.bar uses FXCM, and for BTC/USDT it uses Binance. A signal on a different feed can serve as a guide, but it is not an exact copy of your trading situation.
A training scenario on intrade.bar: from divergence to trade
For a first test, take regular bullish RSI 14 divergence on the five-minute chart of one available currency pair. Compare only two consecutive lows confirmed by your chosen rule. An extra condition: the second low must appear in a support zone marked before the divergence formed. Write down all the settings before you start observing.
Once the second low is confirmed, wait for a candle to close above the high of the previous candle. This is a separate training entry condition, not a universal recipe. If it does not appear within the next three candles, skip the setup. That way you stop stretching the wait until any convenient reversal and can repeat the test on another stretch of the chart.
On the intrade.bar demo, choose the “Call” direction, the same preset amount every time and, say, 10 minutes in Sprint mode. Ten minutes here is a hypothesis to test, not an expiry that is “bound” to work. Before confirming, check the current quote, the expiry and the payout percentage shown. After the trade opens, write down the actual opening price. A 5-minute timeframe and a 10-minute trade duration are different parameters.
Skip the entry if the confirmation came too late, price has already moved far from support, or a move has started that does not fit the rules of your study. Don’t make up for a skipped trade with a bigger amount. When you enter two candles late, it is a different opening point and a different question about the future price.
After expiry, compare your notes with the trade history. A rise half an hour later does not fix the loss on a contract that ended earlier. This check is what turns talk about divergence into research on digital options: the result is decided by your entry and the time you chose, not by your overall impression of the chart.
How to tell whether divergence adds value
Save not only the trades you made but also the setups you skipped, with the reason. For each, note the time of the second extreme, the time of confirmation, the entry, the expiry, the result and the indicator settings. It is convenient to keep the screenshot and comments separately, and to export your intrade.bar history to CSV and check it against your notes.
Compare your chosen setup with the same support and confirmation-candle rule without the divergence requirement. That will make it clearer whether the extra condition improves your selection or merely reduces the number of observations. Use the first test to iron out mistakes, and run the next one on a new period without tweaking the rules.
In intrade.bar statistics, look at results by asset and expiry, but don’t declare the method a winner after three successful entries. Take into account the amounts, the percentages shown and losing streaks. Start with one carefully recorded scenario on the demo: the goal of the first session is to follow the rules without improvising. You already know how to draw a pretty diagonal; now it matters to learn how to check what it means.
Questions and answers
Does divergence always predict a reversal?
No. It shows a mismatch between the chosen extremes. Price may continue its previous move or shift into a range. A trade needs separate rules for confirmation, entry and expiry.
Which expiry should I choose on intrade.bar?
Divergence does not come with a ready-made expiry. Choose an available expiry before the test and evaluate a series of identical setups on the demo. Don’t pick the expiry based on a future chart you have already seen.
Why did the signal appear on an old candle?
The algorithm may have waited for later candles to confirm the extreme. Record the time the signal actually appeared; the position of the historical arrow does not always match that moment.
Can I combine regular and hidden divergence?
You can keep a shared archive, but mark the type separately. These patterns describe different combinations of price and indicator; mixed statistics hide which idea actually produced the result.
Place your first practice trade
A demo account opens right after registration